Week 3 (2/14-2/20)
Notebook
Download the notebook file: week_3_class.ipynb.
Weekly digest
Jupyter Notebook extensions
ipywidgets and interact
k-means
supervised vs unsupervised machine learning
k-means clustering algorithm
Resources
1. k-means
[1]:
%config InlineBackend.figure_format = 'retina'
import numpy as np
import matplotlib.pyplot as plt
from matplotlib.colors import ListedColormap


def get_distances(X, Y):
    """
    Given 2-dimensional numpy arrays X and Y
    returns a 2-dimensional array whose (i, j)-entry
    is the square of the Euclidean distance between
    the i-th row of X and the j-th row of Y
    """

    return np.sum((X[:, np.newaxis, :] - Y[np.newaxis, :, :])**2, axis=-1)


def kmeans(X, n):
    """
    Implements the k-mneans algorithm.

    X:
        2-dimensional numpy array whose rows are coordinates of data points.
    n:
        Integer, the number of clusters.

    Returns:
        A list of tuples (labels, centers), one tuple for each iteration step.
        labels is a 1-dimensional array with labels od points in X, centers is
        a 2-dimensional array with coordinates of centroids of clusters.
        The last tuple on the list is the clustering final result.
    """

    X = X.copy()
    h = X.shape[0]
    centers = X[np.random.choice(h, size=n, replace=False)]

    new_centers = np.zeros_like(centers)

    steps = []
    while True:
        d = get_distances(X, centers)
        labels = np.argmin(d, axis=1)
        steps.append((labels, centers))
        for j in range(n):
            new_centers[j] = np.mean(X[labels == j], axis=0)
        if np.array_equal(centers, new_centers):
            break
        else:
            centers = new_centers.copy()
    return steps


def plot_clusters(X, labels=None, centers=None):
    """
    Plots clusters and their centoids.

    X:
        2-dimensional numpy array whose rows are coordinates of data points.
    labels:
        1-dimensional numpy array with labels of points in X.
    centers:
        2-dimensional numpy array whose rows are coordinates of cluster
        centroids.
    """

    if labels is not None:
        n = len(set(labels))
    else:
        n = 1
    colors = ListedColormap(
        ['tab:blue', 'tab:red', 'tab:green', 'tab:orange', 'tab:purple'][:n])
    plt.figure(figsize=(6, 6))
    plt.scatter(X[:, 0], X[:, 1], c=labels, marker="+", cmap=colors)
    if centers is not None:
        plt.scatter(centers[:, 0],
                    centers[:, 1],
                    c=range(centers.shape[0]),
                    s=250,
                    linewidths=3,
                    edgecolors="k",
                    cmap=colors)
    plt.show()


def plot_iteration(X, steps, k=0):
    """
    Plots clusters computed by a given iteration of k-means.

    X:
        2-dimensional numpy array whose rows are coordinates of data points.
    steps:
        A list with cluster data produced by the kmeans function.
    k:
        An index of the steps list
    """

    plot_clusters(X, steps[k][0], steps[k][1])
2. Plotting nearest neighbors
[2]:
%config InlineBackend.figure_format = 'retina'
import matplotlib.pyplot as plt
from matplotlib.colors import ListedColormap, Normalize


def plot_clusters(X, y, p=None, p_label=None, neighbors=None):
    """
    Plots nearest neighbors of a given point.

    X:
        A 2-dimensional numpy array with coordinates
        of points in clusters
    y:
        A 1-dimensional numpy array with labels of points
    p:
        An array with coordinates of the point whose
        neighbors will be plotted.
    p_label:
        The predicted label of the point p.
    neighbors:
        A list of row numbers of X which are the nearest
        neighbors of the point p.
    """

    # build a custom colormap
    col_list = ['dodgerblue', 'limegreen', 'red', 'orange', 'fuchsia']
    colors = ListedColormap(col_list)
    norm = Normalize(0, len(col_list))

    plt.figure(figsize=(8, 8))
    with plt.style.context('seaborn'):
        scatter = plt.scatter(X[:, 0],
                              X[:, 1],
                              c=y,
                              s=90,
                              cmap=colors,
                              norm=norm,
                              label=y)
        if p is not None:
            p_col = "k" if p_label is None else colors(norm(p_label))
            plt.plot(p[0], p[1], marker="*", mfc=p_col, mec="k", ms=30, mew=2)
        if neighbors is not None:
            plt.scatter(X[neighbors, 0],
                        X[neighbors, 1],
                        edgecolors='black',
                        linewidth=3,
                        facecolors="None",
                        s=300)
        plt.legend(*scatter.legend_elements(),
                   markerscale=1.5,
                   prop={
                       "size": 12,
                       "weight": "normal"
                   })
    plt.show()
Exercises
Exercise 1
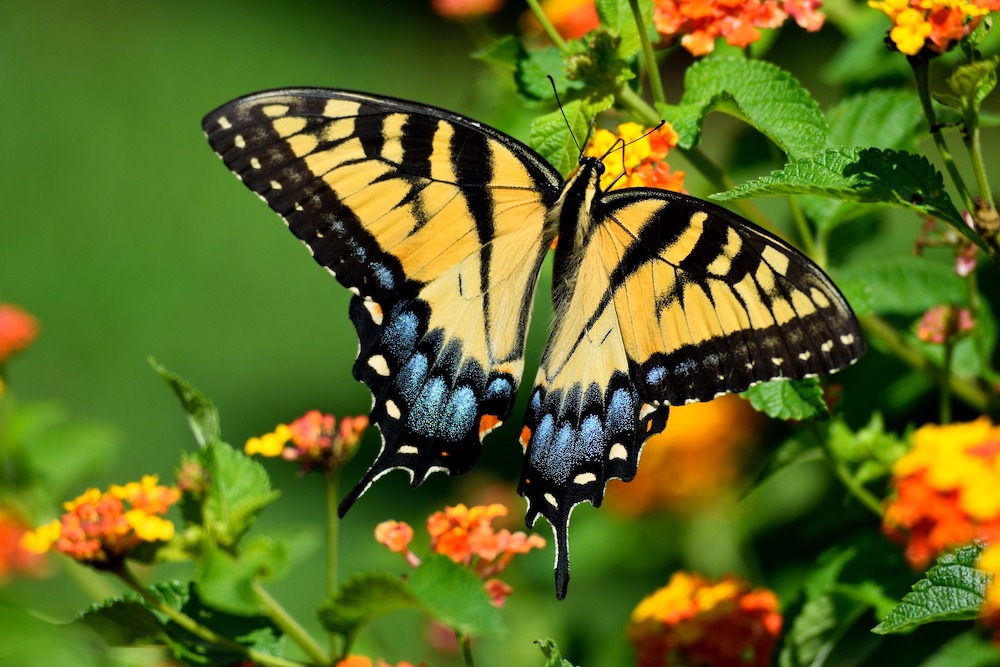
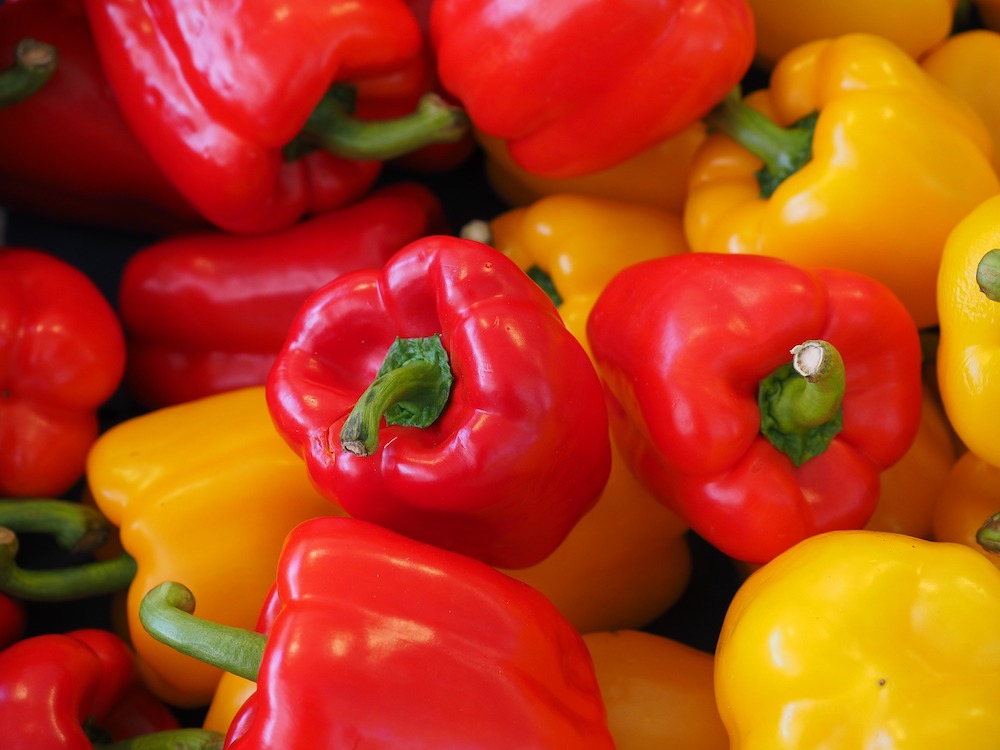
Here are some JPEG image files (you can also use other images for this exercise):
Use the k-means algorithm to organize colors of pixels in these images into \(k\) clusters (for different values of \(k\)).
Make a plot showing colors of cluster centroids.
Display the images, but replace the color of each pixel with the color of the centroid of the cluster to which the pixel belongs.